21 Aug, 2026
Drupal Performance Optimization & Core Web Vitals Guide


Enterprise Drupal sites can face tougher Core Web Vitals challenges than a five-page brochure site. This is because Drupal is designed for complex content models: content types, layered permissions, multilingual variants, Views pulling from several entity references on one page. That's exactly what makes generic Drupal performance optimization advice ineffective. A site with 40,000 nodes and a dozen editors publishing daily behaves nothing like a static page, and needs a different playbook, especially when it is the choice of CMS for governments, educational institutions, and large enterprises.
At Innoraft, we've audited Drupal sites where every module was "fast" in isolation, yet the homepage still failed LCP on mobile. To resolve performance issues on Drupal, our team implements fixes that go beyond the basics. But before we get to the nitty gritty, let’s take a look at what Core Web Vitals are, and why your site is having difficulty meeting these Drupal Core Web Vitals.
What Are Core Web Vitals, Translated for Drupal?
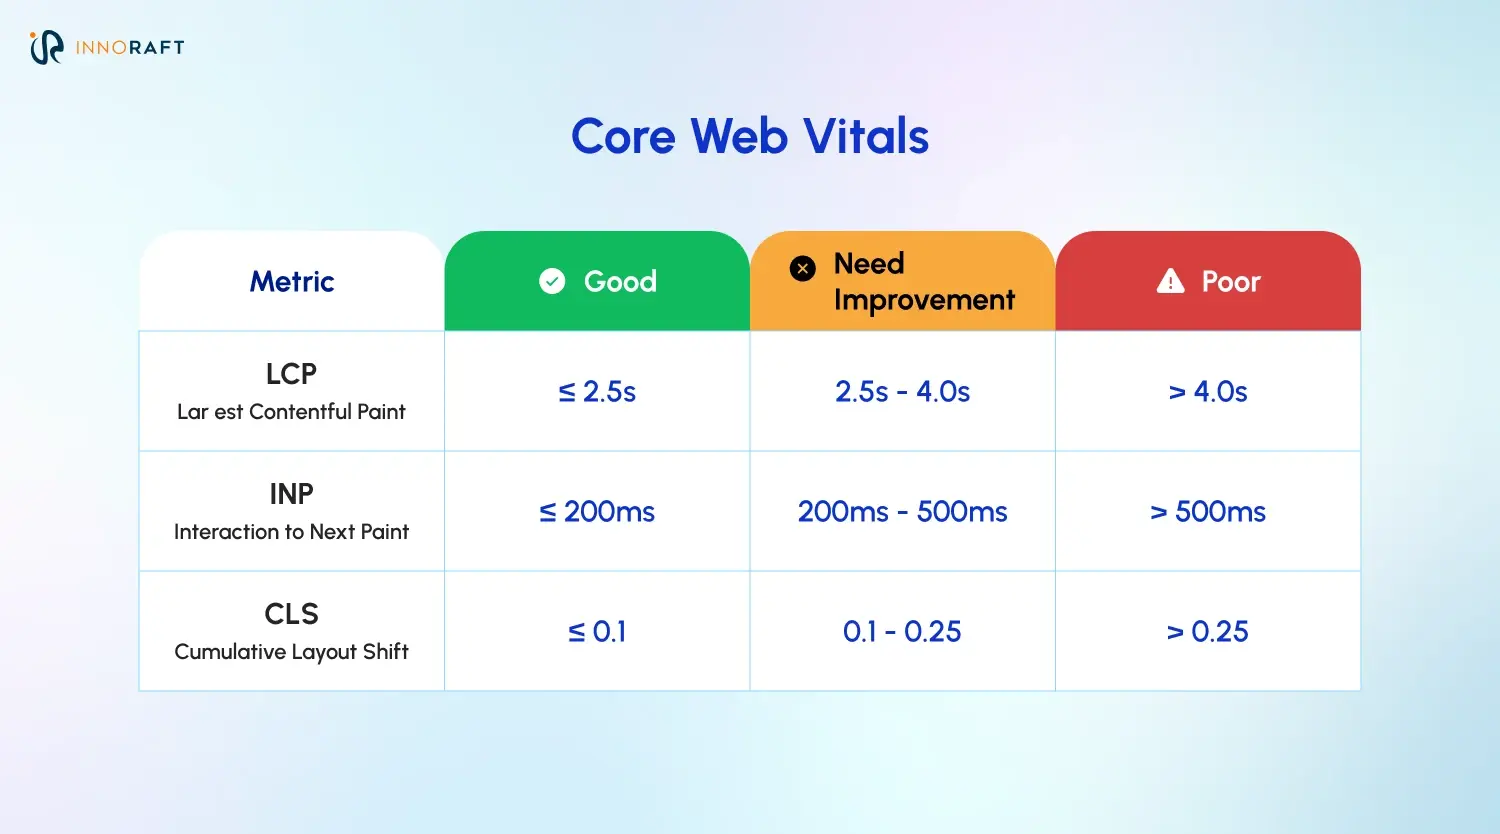
Core Web Vitals are three field metrics Google uses to grade user experience: loading speed, responsiveness, and visual stability, evaluated using field data at the 75th percentile. Meeting these Core Web Vitals ensures the speed and scalability of your Drupal business site.
Why Does LCP Suffer on Drupal Sites?
When it comes to Drupal performance optimization, two common contributors are slow TTFB from expensive server-side work, and rendering strategies that delay content already ready.
Complex Views can trigger extra database queries and entity loads, especially with relationships, exposed filters, and access checks left uncached. A high TTFB delays when the browser can begin processing the HTML, which pushes LCP later, since the browser can't paint before that response arrives. TTFB is a major contributor, not the whole story: fonts, render-blocking CSS, and the hero image (if that's the LCP element) matter too.
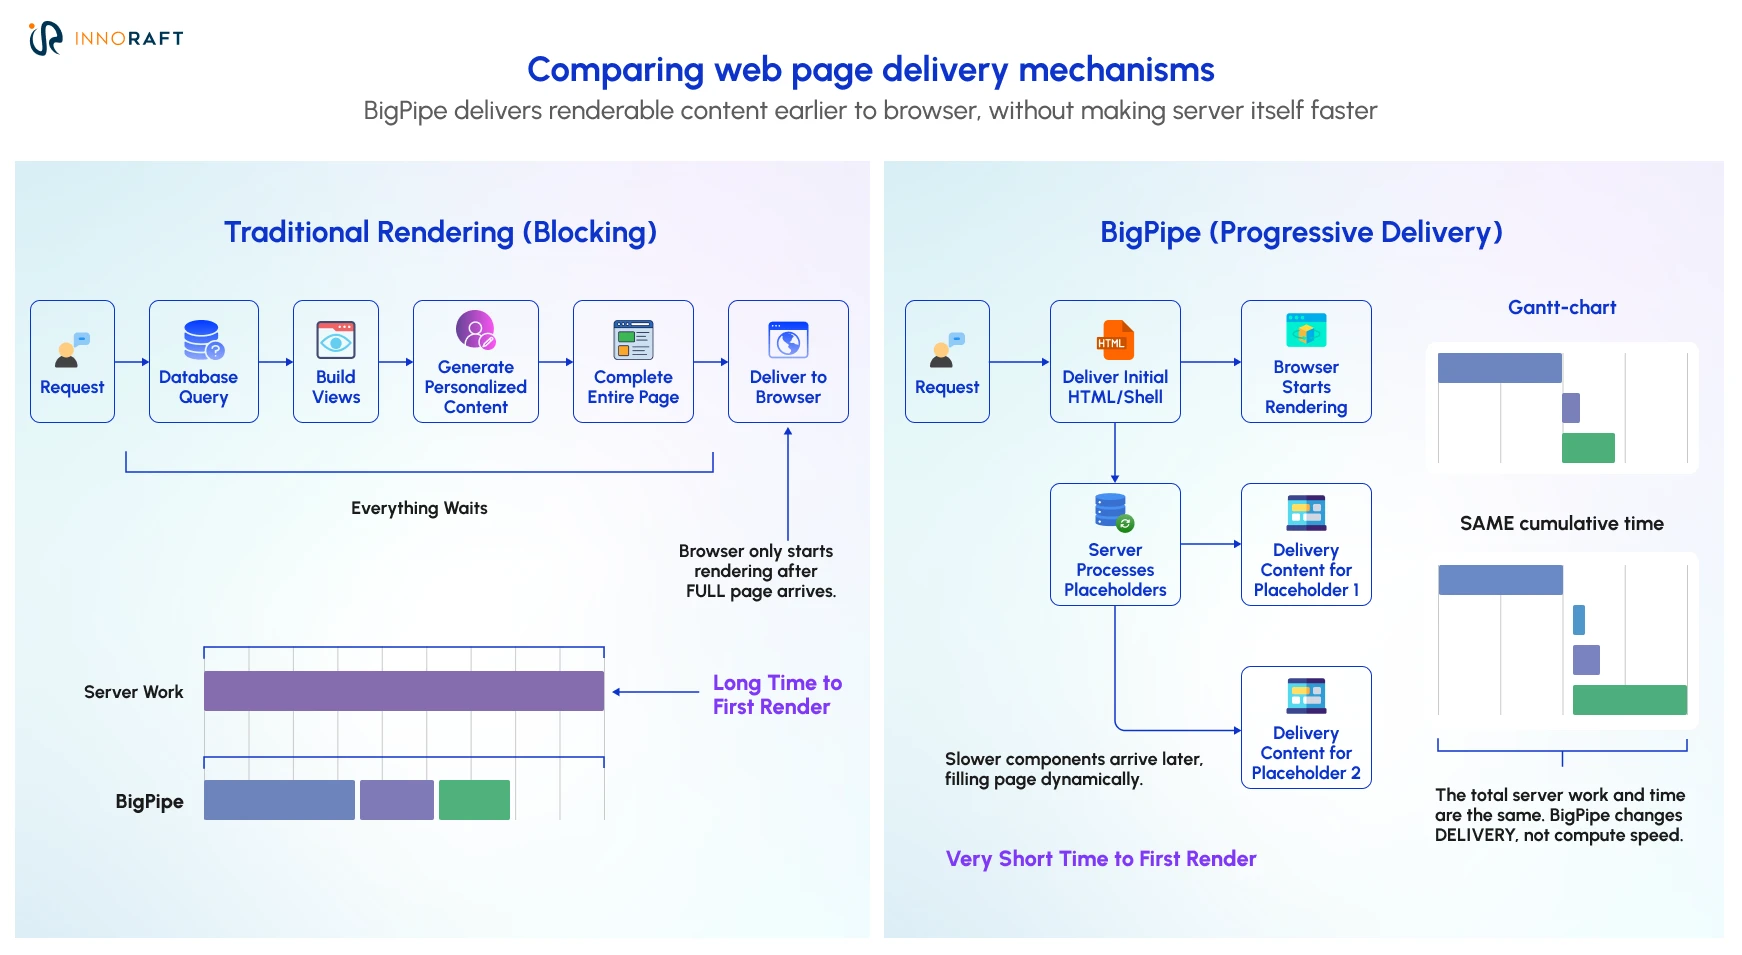
BigPipe addresses the second half. Instead of holding the response until every personalized fragment finishes rendering, BigPipe can flush the static shell before slower placeholders are ready, then stream those in after. In core since 8.1, stable since 8.3. It doesn't cut server-side processing time, but lets cacheable content reach the browser sooner and improves Drupal website performance.
What Is INP and Why Does Drupal's JavaScript History Hurt It?
INP measures how long a page takes to visually respond to a click, tap, or keypress, and it's a metric attached to Drupal speed optimization that exposes JavaScript-heavy Drupal implementations clearly. The usual culprit is legacy JavaScript that never got cleaned up, whether it comes from Drupal itself or a third party.
Drupal.behaviors doesn't strictly require jQuery, but it's historically been closely tied to it, and older behaviors can re-run work on every AJAX load if they skip Drupal's once() API. On enterprise sites, third-party scripts, tag managers, analytics, chat widgets, are often the bigger INP problem: load them through a tag manager with explicit triggers, not hardcoded in the theme. Because INP tracks latency across the visit and reports close to the worst interaction, one slow interaction can drag the score down.
Untangling this doesn't require ripping out jQuery in one sprint. Audit *.libraries.yml for scripts declaring core/jquery unnecessarily, confirm behaviors use once() instead of re-binding on every attach, and break up long tasks using techniques such as scheduler.yield() or requestIdleCallback() where appropriate to improve Drupal page speed.
What Causes CLS Problems on Drupal Sites?
A common underlying cause of CLS is that the browser lacks information to reserve space for content before it arrives, though injected banners, late fonts, and animations contribute too. During Drupal performance tuning, common places to investigate include Media Entity images, OEmbeds, and CKEditor output.
A Media Entity image field shifts the layout when the rendered markup carries no intrinsic dimensions or aspect ratio to reserve space from, a configuration issue in the responsive image style, not something inherent to Media Entities. OEmbed video can be worse, since embedded players sometimes resize their iframe after the initial paint. CKEditor output occasionally brings inline styles that fight your theme's grid, a less consistent offender, worth checking rather than assuming.
The real fix isn't manual QA on every node. Reserve an aspect ratio on the rendered image or its container, wrap OEmbed output in a fixed-ratio container, and audit editor-pasted markup for stray inline sizing.
How to Fix Core Web Vitals to Improve Drupal Performance Optimization?
Here are 5 steps we leverage as an expert Drupal website maintenance and support agency to make sure your Drupal site maintains best performance.
Step 1: How to Fix TTFB Before Caching Even Kicks In
Fix TTFB by tuning PHP 8.x's OPcache, caching expensive Views, and confirming Twig debug mode is off. None of this touches caching yet. This is the engine room of Drupal site optimization.
- Monitor OPcache usage and size opcache.memory_consumption to your codebase, and make sure deploys invalidate it on release.
- Cache Views results with a time-based or custom cache plugin instead of "None," for listings whose freshness needs to tolerate a defined lifetime.
- Check your service-container configuration for two settings: twig.config.debug, which enables auto-recompilation and debug output, and twig.config.cache, which controls the Twig cache itself. Debug should be off in production; cache should stay on.
- Check slow-query logs and confirm indexes exist on columns your Views filter or sort by; a missing index is often why a "cached" View still feels slow on a miss.
Step 2: How to Master Drupal's Cache Hierarchy
To improve Drupal page speed, you need to master the hierarchy by knowing what each layer caches, then offload the rest to Redis or Memcached.
| Cache Layer | Serves | Handles Logged-In Users? | Typical Win |
| Internal Page Cache | Full anonymous page responses | No | Near-instant repeat loads for anonymous traffic |
| Dynamic Page Cache | Cacheable parts of the page render | Yes | Skips expensive render logic for authenticated sessions too |
| Redis / Memcached | Drupal's cache bins and other configured backends | Depends on configuration | Reduces latency of cache storage and retrieval |
Drupal's cache bins already contain more than rendered markup. They also contain computed data and other intermediate results. Suitable bins are migrated to an in-memory backend such as Redis, alleviating the latency and database overhead of accessing them.
Step 3: How to Configure Edge Delivery With Varnish or Fastly
Configure edge delivery with Varnish or Fastly and Drupal Cache Tags using the Purge module. When you do a content edit it will only be invalidated rather than flushed.
Drupal's Render API propagates cacheability metadata up the render tree when optimizing Drupal website performance: cache tags identify the data a response depends on, cache contexts capture what it varies by, and max-age handles time-based expiration. Purge listens for invalidation events and propagates them to the configured proxy or CDN, rather than flushing everything. In our experience, a stale-content incident without Purge is often what makes teams give up on edge caching entirely, defeating the point of running Varnish at all.
Step 4: How to Manage Assets Without Blocking the Main Thread
Manage assets by marking non-critical scripts as deferred or async. On Drupal 10.1+ or 11, also check whether AdvAgg is still installed.
mylibrary:
  js:
    js/my-script.js: { attributes: { defer: true } }
That single attributes: { defer: true } line lets the browser download a script without blocking HTML parsing, then run it once parsed for Drupal speed optimization. Apply it selectively; a script with initialization-order dependencies can break if deferred blindly. Core's CSS/JS aggregation improved substantially as of 10.1, picking up async aggregate generation and minification that used to require AdvAgg, and the project now recommends uninstalling it on Drupal 10.1+ and 11 unless you depend on functionality core doesn't cover, like certain bundling or compression features.
Step 5: What's the Best Way to Handle Images in Drupal?
To improve Drupal page speed, let core do the conversion work through Image Styles, serve the right size per breakpoint with Responsive Image, and generate WebP or AVIF instead of uploading pre-converted files.
Drupal 10 introduced WebP support in Image Styles, and Drupal 10.3 updated all shipped core image styles to convert to WebP by default. Among various features added on Drupal 11.2 native AVIF conversion with WebP fallback is a critical one, especially when the server's image toolkit, GD or ImageMagick compiled with AVIF, supports it, not guaranteed on every host. In one test on the core Umami profile, switching from WebP to AVIF cut derivative storage by roughly 40%; real-world LCP benefit also depends on image dimensions and network conditions.
Pair that with Responsive Image so a hero banner doesn't ship a 2400px desktop file to a 375px mobile viewport, addressing two common contributors to slow LCP and layout shift and affect Drupal website performance. If the hero image is your LCP element, don't lazy-load it; prioritize its delivery instead. Fonts are worth a look too: self-host and preload only what the design needs.
Is It Time to Go Headless?
Sometimes decoupling Drupal seems like the best way for Drupal performance tuning; moving most page-rendering responsibility to a separate frontend, while Drupal keeps doing what it's genuinely good at, structured content and editorial workflow.
A framework like Next.js can use static generation, server-side rendering, or edge delivery to control how content reaches the browser, with Drupal's traditional Twig pipeline no longer rendering the frontend. That's useful for multi-lingual and multi-site needs, as well as content-heavy sites with global audiences and CDN-first needs. It isn't automatic, though: React and Vue are UI libraries, not rendering strategies, and a poorly built decoupled frontend can produce worse Core Web Vitals than a well-tuned Drupal site.
It isn't free, either. Editors lose in-place editing and live preview unless it's rebuilt separately, and you now maintain two codebases with two pipelines. If you are struggling with Drupal website performance, the real question isn't "should we go headless?". It's whether the bottleneck is architectural, or simply that nobody enabled BigPipe and Dynamic Page Cache yet.
How to Monitor Core Web Vitals Continuously?
Monitor continuously by treating Lighthouse as a debugging tool and CrUX or Search Console as the scorecard. Mixing them up is a common mistake in Drupal performance optimization.
Why Doesn't Lab Data (Lighthouse) Match Real Users?
Lighthouse runs one simulated page load on a fixed device profile and network throttle. It's excellent for isolating why a page is slow, and a weaker predictor of what visitors experience, since real users load your site across combinations Lighthouse never tests.
| Lab Data (Lighthouse) | Field Data (CrUX / Search Console) | |
| Source | Simulated single load | Real anonymized user sessions |
| Best for | Debugging why a page is slow | Assessing real-world Core Web Vitals performance |
| Update cycle | Instant, on demand | Rolling 28-day window |
| Blind spot | Doesn't reflect real device/network mix | Doesn't tell you why it's failing |
The Chrome User Experience Report aggregates real visits over a rolling 28-day window, and Search Console's report surfaces that same data by URL pattern. That's field data, and it's what matters when assessing real-world Drupal website performance. A page can score 100 on Lighthouse and still fail INP in Search Console if enough visitors are on mid-range Android devices over patchy 4G.
What Tools Should You Actually Use, and How Do You Read Them?
Use WebPageTest for a full waterfall view, Chrome DevTools' Performance panel for a moment-by-moment breakdown, and Search Console for the field verdict. Reading a Drupal site optimization waterfall means knowing a cache miss from a bloated DOM.
A cache-miss TTFB shows up as one long, isolated bar before anything else starts, with nothing queued behind it, often indicating server-side page generation or another origin-side delay. Compare that against a cache hit on the same URL to see how much caching removes. A bloated DOM looks different: TTFB is fine, but the browser spends a long stretch in "Rendering" and "Scripting," often laying out a large, deeply nested page, a Views listing with many rows, or stacked paragraphs and blocks. Fix the first with caching, the second by trimming markup.
What's the Best Way to Prioritize All of This?
The best way to start with Drupal speed optimization is diagnose first, then fix the highest-impact bottleneck. That's usually server, then cache, then frontend, since Drupal's rendering pipeline sits underneath everything else. But it isn't a rigid rule: an oversized hero image can dominate LCP with a fast TTFB, and a rogue third-party script can dominate INP regardless of caching. Use the diagnostic order above to find what's broken first.
Passing Drupal Core Web Vitals isn't cosmetic. Google's case studies show businesses reporting meaningful results after prioritizing it: Tokopedia reported a 23% rise in session duration after a 55% LCP improvement, and Nykaa reported 28% more organic traffic from T2/T3 cities after a 40% LCP fix. These illustrate potential impacts. It is true that Drupal won’t make meeting Core Web Vitals easy by default, but it will hand you more precise control. All you need to do is to utilize it.
Wondering how to begin Drupal performance optimization of your business site? Innoraft’s Drupal experts are just one call away! Contact us today.
FAQ
Frequently Asked Questions
Didn’t find what you were looking for here?